
 HK
HK
Activity
Challenge Categories
Challenges Entered

Play in a realistic insurance market, compete for profit!
Latest submissions
See All| graded | 125389 | ||
| graded | 125263 | ||
| graded | 125220 |

Latest submissions
| Participant | Rating |
|---|---|
 aman_patkar
|
0 |
| Participant | Rating |
|---|
-
WorldExperts Insurance pricing gameView
Insurance pricing game

Ideas for an eventual next edition
About 5 years agoGreat idea! Having a rolling training set and testing set is more realistic. Also it is more exciting for the participants as they would have a new dataset to play with every 2 weeks.
My some other thoughts:
It is better for the RMSE leaderboard to have the same format as the final scoring round. I understand that claim_amount column is dropped in the RMSE leaderboard to avoid probing, but this column is actually available in the final round. This caused some confusions.
To make the weekly feedback more informative, maybe showing a distribution curve is better than just a mean. This can help us to know whether we are targeting the right segments.
Uncertainty quantification type models
About 5 years agoYes. I have tried using the standard deviation of the expected claim as a pricing factor for week 6&7. I actually thought it would be my killer for this game…
price = 1.15E(claim) + 0.01Std(claim)
However, the result was quite bad (but at that time i do not have large claim detection model). I decided not to go with this approach since week 8, only 3 weeks left and i still have a profit loading to test… cant afford to add more variables in my pricing strategy.
The implementation that I was referring to is:
Going one more step forward, there are actually two types of uncertainty,
a) enough data but the target variable itself is having high variance
b) not enough data so that the model can just extrapolate
The conditional variance measures (a) only, where for (b), i think most of us just manually add some loadings to the policies that we are not willing to take due to limited data. This can be solved by training a baynesian network (for example by tensorflow-probability), but I didnt have time to try it.
I will tidy up my code and share with everybody soon.
Sharing of industrial practice
About 5 years agoJust included the link in my reply!
For the “no models” part, your description is exactly what I heard from my friends working in this field. Some insurers may simply just take a discount based on the competitors’ pricing…
Sharing of industrial practice
About 5 years agoHi Guillaume,
Thanks for the sharing. Talking about ML-powered GAM, I have found two interesting approaches.
- InterpretML from Microsoft
- Mixing GAM with GBM
- Pre-built visualization methods for “black-box” model
- GAMI-net by HKU scholars
https://github.com/ZebinYang/gaminet
- Mixing GAM with NN
- The code base is not as user-friendly as Interpret-ML
I think these worth a look for the practitioners who are looking for ML-powered GAM with interpretability.
Sharing of industrial practice
About 5 years agoHi,
I think there are quite a lot of senior actuaries / data scientists participating this competition. Would you mind sharing how the industry price a GI policy?
From the approach sharing post, I can see many of us have tried Tree, NN and even Reinforcement learning. It would be interesting to know if these approaches are being used / explored currently. From my friend (general insurance, Asia), GLM still dominates.
Ye olde library
About 5 years agoI also spent some time in reading Michael’s approach during this competition. In fact I also tried some NN approaches but they cannot beat XGBoost significantly.
It looks like denoising auto encoders (DAE) perform particularly well when the feature is anonymous, as it allows the model to learn the relationship between the features automatically. In this competition, the feature engineering by human still has an edge.
In the Jane street competition, DAE is a common approach as the features are also anonymous and the dimension is huge.
"Asymmetric" loss function?
About 5 years agoRMSLE is one of the asymmetric loss functions but I have not explored further in it.
Two characteristics:
-
RMSLE is greater when the model underestimates
-
Due to the log, it is more robust to outlier (which can be a bad / good thing?).
It's (almost) over! sharing approaches
About 5 years agoThanks for everyone sharing their approach!
Mine:
Feature
- Similar to Simon I have a vh_current_value which is exponentially decayed yearly with factor 0.2 and a floor value of 500
- Claim history:
- Aggregated total claim count, total claim amount and years from last claim (10 if no claims before)
- Change in no claim discount, number of years with no claim discount increased
- Interaction variables (not all but some)
- Binning (Good for GLM as it is quite sensitive to outliers)
- I dropped the vh_make_model as I think the vehicle information is mostly reflected by vh_value, vh_weights etc., the noise-to-information ratio is too high for that
- I grouped Med1 with Med2 as they are very similar
- Population per town surface area ratio
- Some log-transform / power transform of numerical variables
I use same feature sets for large-claim detection model and claim estimation model.
Large Claim detection model:
A XGBoost and Logistic regression model to predict whether a claim would be >3k.
Claim estimation model:
I stacked 7 base models using a Tweedie GLM as the meta-learner under 5 fold CV.
Base models:
- Tweedie GLM
- Light GBM
- DeepForest
- XGBoost
- CatBoost
- Neural Network with Tweedie deviance as loss function
- A neural network with log-normal distribution likelihood as loss function (learning the mu and sigma of the loss)
Pricing
Price = (1 + loading) * (estimated claim) + fixed_loading
If predicted to be large claim, loading = 1
If not: loading = 0.15
fixed_loading = 5
Since I filter out most of the predicted large-claim policies, my average premium is quite low (~65). So the estimated profit ratio is about 15% + (5/65) = ~22%.
Week 10 discussion!
About 5 years ago
Same model, reduced profit loading -> higher market share but slightly negative profit
Hmm… I think I will tweak my profit loading a bit again
Was week 9 a lucky no large claims week?
About 5 years agoMy guess on why high profit loads are required:
As the (top 10) competitors are becoming niche and better, it is more likely for us to pick up underpriced policies, therefore apply a higher profit load protect us against it. All in all, if we have a super high profit load and not winning many policies, our profits will be close to 0 and enough to beat many other competitors. In other words, to beat the top and niche player, we need to be niche as well!
Was week 9 a lucky no large claims week?
About 5 years agoI have the same confusion as yours too.
If the number of policies is equally split among [often, sometimes and rarely] (the nominator), and the fractions are different, the denominator must be different.
Was week 9 a lucky no large claims week?
About 5 years agoThanks for the reply. But Nigel has never got a claim size of 10k shouldnt it be nan for his as well?
Was week 9 a lucky no large claims week?
About 5 years ago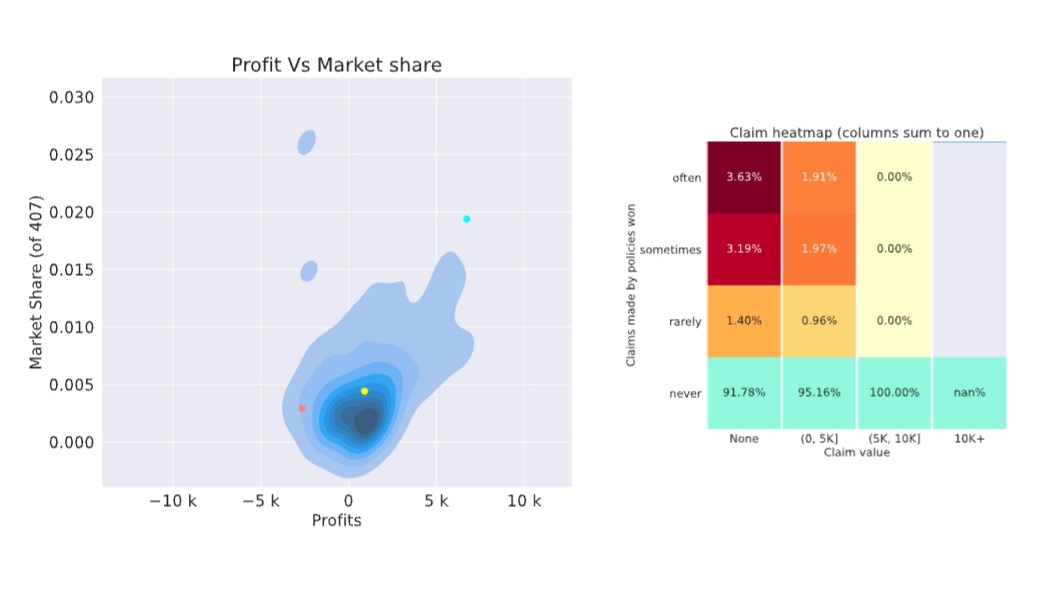
Seems it is a lucky week for us. Somehow I got nan in my report, not sure if it is related to my super low market share .4%
Weekly Feedback // Evaluation clarification?
Over 5 years agoThe profit of nigel’s model has 3 clusters around -150k, -100k and -50k which suggests it takes up 1-3 large losses in these clusters.
Weekly Feedback KPI Averages clarification?
Over 5 years agoI have similar struggle as yours… Low market share --> Low profit / loss yielding moderate leaderboard position. Not sure if I should lower the price more…
But having (extremely) low market share also means that the profit/loss is unstable in some sense (cannot really represent you are pricing accurately or not as it is too noisy). I think I will just try to grab more market share first, to get more sense of my expected claim bias. Maybe that’s also the rationale of most teams, which explains why almost every team is losing money.
Week 3 leaderboard is out!
Over 5 years agoHi @alfarzan,
I cannot open the link for the week3 feedback, it “shows invalid response”, while there is no issue for the new week2 feedback.
My submission ID for week3 profit LB is #113794.
Thanks!
David
RMSE training vs leaderboard
Over 5 years agoSame here.
How do you treat those extrme claims?
For now I am using a cap, but I am also considering dropping those rows instead of it.
1st place solution
About 5 years agoHi all,
Very surprised and feeling lucky to be the first place in the final round. I didnt make much changes except adding claim history features ($ of past claim made, # of past claim made, year since last claim) and reducing the profit loading by 1%.
I have uploaded my code on github. (https://github.com/davidlkl/Insurance-Pricing-Game). A bit messy in order to do all the tricks and hacks (making the zip submission work).
I enjoyed the discussion with all of you very much throughout the game. I took this game as an opportunity for me to explore new idea / new techniques in both data science and actuarial field. Also thank you @alfarzan2 very much for the the patience to answer all of our questions!